
Women in Leadership in 2023
Sandi Toksvig gave a Ted Talk in 2016 on Women’s representation in Politics and the top 100 companies in the London Stock Exchange. We took the time to update her infographics with 2023 data.

Charleston, SC through the lens of Mayoral Candidate Mika Gadsden
This month I sat down with Charleston mayoral candidate Mika Gadsden to talk about the issues that inspired her to run. It is these issues, among others, that inspired Mika to run for Mayor in 2023.

The History of Redlining
This infographic series visualizes the history of Redlining practices in the United States.

Gun Violence in the United States
Trigger Warning: A data story on gun violence in the United States.

Guide to: Urban Sketching
A guide to urban sketching with a variety of materials and subjects.

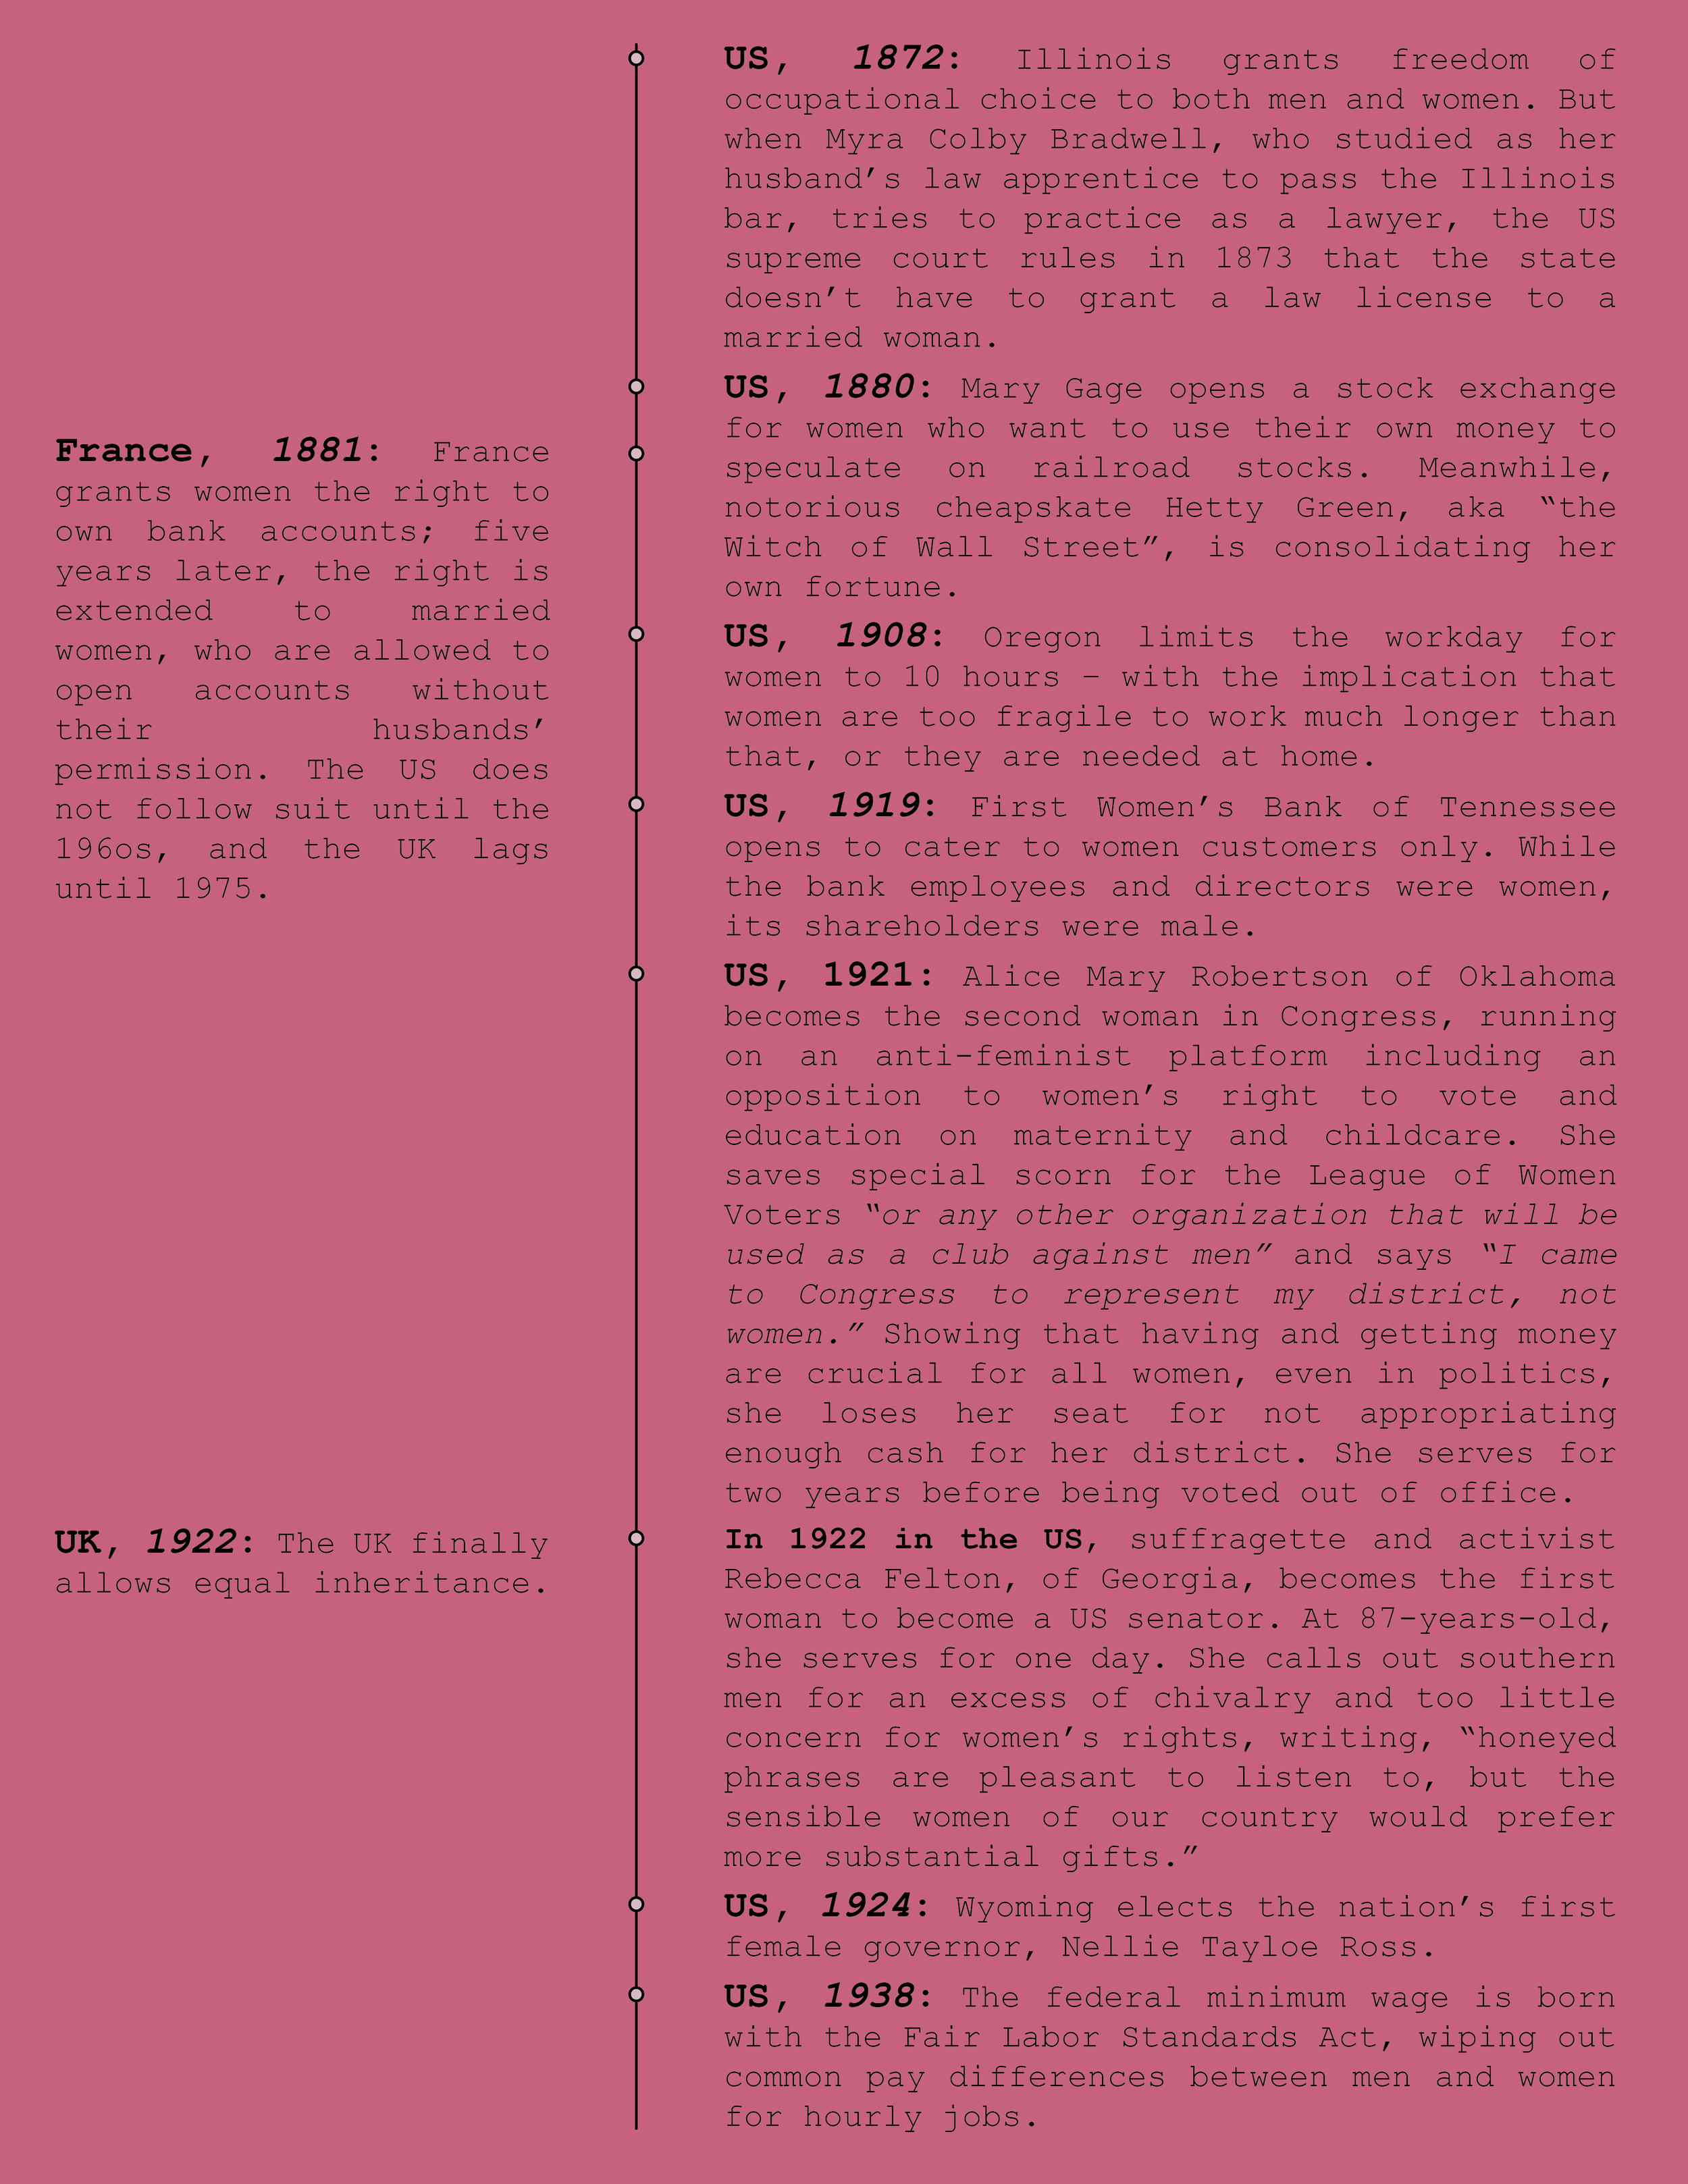
Self Care & Women in Finance
It’s important to acknowledge how far we have all come, so that we can move forward in a positive direction.

Race in America
This infographic series, originally published in 2020 about Race in the United States of America.


Small Business Saturday at the Feminist Magic Market
As the last Feminist Magic Market of the year approaches and holiday shopping ramps up, I took time to visualize data around holiday shopping and women-owned businesses in the United States.

Why Pronouns Matter - Transgender Day of Remembrance
On this Transgender Day of Remembrance, we look at the increased levels of violence that transgender individuals may deal with and why recognition of pronouns is so essential.

Women in Leadership
Sandi Toksvig gave a Ted Talk in 2016 on Women’s representation in Politics and the top 100 companies in the London Stock Exchange. We took the time to update her infographics with 2022 data.
